| Cost: | Difficulty:
|
Danger 2: (Minor injury possible) | Utility:
|
------------------------
|
Visual Illusions That Can Be Achieved By Putting a Dark Filter Over One Eye |
||||||
|
--------------------- |
||||||
|
by Jearl Walker |
||||||
|
--------------------- |
||||||
|
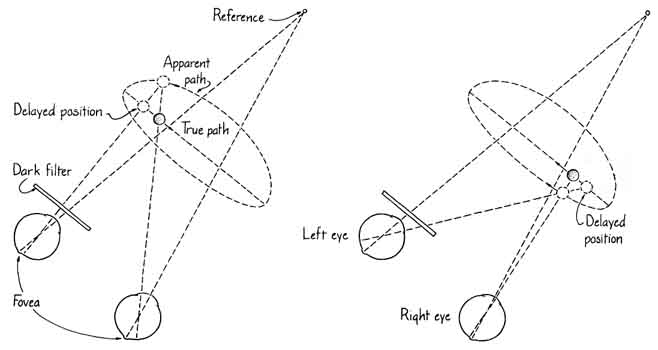
For the purpose you need three things: a simple pendulum consisting of a weight on the end of a string, a partially dark filter such as one glass from a pair of sunglasses and a thin vertical object. Set the pendulum swinging in a plane perpendicular to your line of sight and place the thin object behind it. Put the dark filter over one eye and look with both eyes at the background object. The pendulum will seem to be moving elliptically. With the filter over the left eye the rotation is clockwise from an overhead sense; with the filter over the right eye it is counterclockwise. Increasing the darkness of the filter increases the apparent depth of the elliptical path. Somehow the dark filter causes you to perceive a motion with depth when there is no depth. Pulfrich explained the illusion after an associate suggested that the dark filter delays the image the eye affected by the filter sends to the brain. (Pulfrich himself was blind in one eye and was never able to see the illusion.) The suggestion turned out to be correct. When the illumination to one of your eyes is decreased, your perception of the scene from that eye is delayed by some tens of milliseconds from the perception you receive from the uncovered eye.
Suppose your left eye is covered by a dark filter and a pendulum is beginning to swing from left to right. Your eyes are fixed on a background object, with the result that its image falls on the fovea (the small depression in the retina that provides the sharpest vision). The images of the pendulum bob lie off center from the fovea, but because of the visual delay from the left eye the image of the bob in the left eye lies more off center. From that eye you perceive the bob where it was some tens of milliseconds earlier, hence to the left of its true position. The image on the retina is therefore more off center from the fovea than it would have been without a filter. What you apparently sense is the angle between the bob and the background reference object. The angle for the left eye is greater than it is for the right eye, and to make sense of that difference you interpret the bob as being farther away from you than it actually is. The visual delay therefore gives the impression of depth in the motion of the bob. As the bob speeds up in approaching the center of its swing the discrepancy in the angles between the reference object and the bob increases and the apparent depth of the bob increases. As the bob slows down in reaching the right-hand extreme of its swing the discrepancy in the angles decreases and the bob seems to move closer to you. During the swing back the visual delay from the left eye makes the bob appear closer to you than it really is. The "closest" point is near the center of the pendulum's swing, where the speed of the bob is greatest. The overall motion of the bob is an apparent rotation in an elliptical path around a vertical axis. Increasing the darkness of the filter (its optical density) increases the visual delay from the filtered eye and therefore the depth of the elliptical motion. You can most easily control the darkness by using two crossed polarizing filters over one eye. By altering the angle between the senses of polarization of the filters you can select any degree of darkness. With enough darkness the path becomes nearly circular. Finally the filter becomes so dark that the illusion is lost because you see the bob only through the unfiltered eye. Then the perceived motion is the actual linear motion. The physical processes resulting in the delay in visual signals to the brain are not completely understood. The visual latency is caused either by the decreased intensity of the light reaching the retina or by a change in the adaptation of the eye. Perhaps both factors are involved. (The eye adapts to changes in illumination by varying the size of the pupil and by producing more or less of the pigment involved in the visual process.) One model of the latency regards the visual pathway as being a series of four identical electrical delay lines, each stage consisting of a resistor, a capacitor and an amplifying unit. Albert M. Prestrude of the Virginia Polytechnic Institute and State University suggested that the four stages may correspond to the layers of horizontal, bipolar, amacrine and ganglion cells in the visual pathway, but this correlation is not certain.
In the analogy the sensitivity of the visual process (that is, how small an input signal can produce a sufficient output signal) depends on the values of the resistors and the strength of the amplifying units. The values of the resistors are not fixed, however, but are controlled by a feedback signal from the final output of the visual system. The response time of the system also depends on the resistor values: the greater the resistance, the longer the response time. The combined effect is that when the stimulus level to the eye is decreased, the feedback signal from the output of the visual process increases the resistance and the amplifying gain in each stage in order to increase the sensitivity. The increased resistance in turn means the system takes longer to respond. Therefore decreasing the intensity to the eye results in greater sensitivity and a longer response time. Since the work of Pulfrich the illusion has been studied in a variety of settings. Some investigators employed two rotating disks, one for each eye. By looking through a system of prisms and lenses an observer could fuse the images of the two disks to perceive a single rotating disk. Each disk bore a radial line. If the disks rotated synchronously, the observer saw a single radial line. Placing a dark filter over one eye, however, caused the synchronization of the lines to be destroyed. By measuring how much the phase between the two disks then had to be altered in order to bring the radial lines back to an apparently synchronized rotation the experimenter could determine the delay introduced by the filter. A particularly interesting technique was employed by Bela Julesz of Bell Laboratories and Benjamin White of San Francisco State University. They showed an observer motion pictures of computer-generated random dots in which each frame was statistically independent of the others. Through separate viewing systems each eye saw a motion picture. In the center of each frame were randomly selected dots that formed part of a square. If only one eye saw the presentation, the sensation of a central square was lost in the apparent random display of dots. If both eyes saw their respective motion pictures simultaneously, the central square was visible and stood out from the background of other random dots. The stereoscopic sensation was due to the slight shift of the left-eye dots in relation to the dots seen by the right eye. The same technique is employed in conventional stereoscopic pictures, in which one eye sees a scene slightly shifted from the other eye's view, creating an illusion of depth. In the experiment of Julesz and White one eye was shown its motion picture one frame later than the other eye. The central square was therefore lost because the selection of dots from frame to frame was randomly different. An adjustable filter was then placed over the eye receiving the earlier frame. The observer adjusted the darkness of the filter until the delay in perception of the frame by that eye was sufficient for the brain to receive the perceptions of the correlated left and right frames simultaneously. The central square became visible again. In the pendulum illusion the apparent depth of the pendulum's motion can be produced by adaptation of your eyes as well as by a dark filter. Shine a dim light into one eye for a few minutes and then watch the swinging pendulum. The illusion of depth appears, just as if the other eye had been looking through a filter. The illuminated eye was adapted for brighter conditions and thus responded faster than usual. Some workers have reported that the illusion also appears if you adapt one eye to darkness. Black out one eye for 15 or 20 minutes and then look at the pendulum with both eyes. You may find a small Pulfrich effect. (Some people do, although I do not.) Still another example of how adaptation enters into the illusion can be seen by carefully watching the depth of the pendulum's elliptical motion as a function of time after placing a dark filter over one eye. There should be an immediate visual latency and hence depth to the motion. Both should increase over the next 20 minutes as the covered eye adapts to decreased illumination. The elliptical motion of the pendulum in the usual Pulfrich illusion disappears if you stare at the bob instead of the background. Apparently in tracking the bob the eyes follow it in its true linear path, maintaining the images of the bob on the same areas of the retinas, eliminating the changing angles between the reference and the bob and thereby destroying the illusion of rotation. The illusion can be regained while you track the bob if you darken the background for one of your eyes. This effect has been demonstrated fairly recently by several workers using oscilloscope traces instead of pendulum bobs. The effect can also be seen with the simple pendulum.
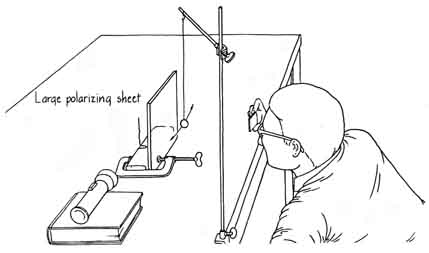
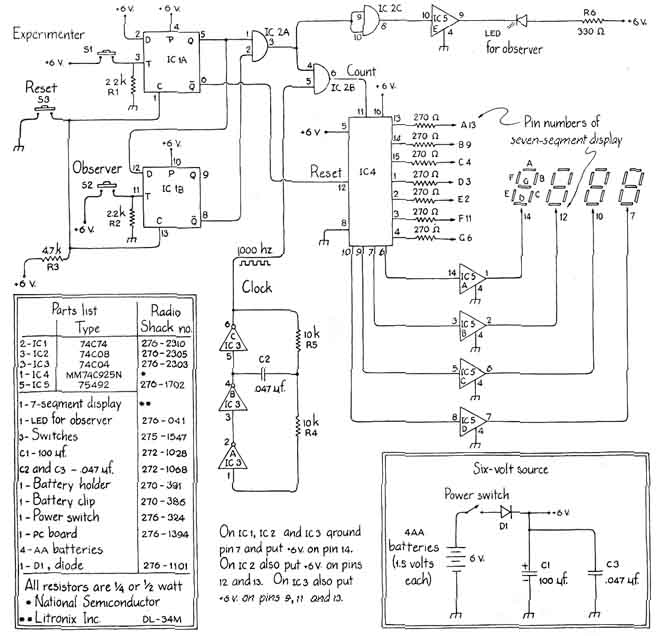
Place a large sheet of polarizing filter behind the pendulum and a small light and the usual reference object behind the filter. (Large polarizing sheets are available from the Edmund Scientific Company, 7778 Edscorp Building, Barrington, N.J. 08007.) Over one eye place a smaller piece of polarizing filter oriented to somewhat darken the background for that eye. The polarizing filter behind the pendulum must be large enough so that when the pendulum swings, the filter remains as a background. Now track the bob. If the left eye sees a darker background than the right eye, the bob appears to rotate clockwise as before in spite of the tracking. Darkening the background by rotating the polarizing filter over the eye predictably increases the depth of the bob's elliptical path; putting the small filter over the other eye yields the expected counterclockwise motion. As the images of the large polarizing filter and the reference object move across the retinas the increased visual latency of the filtered eye creates the illusion that the distance between the bob and the reference object is constantly changing. Much of the changing depth is attributed to the bob, perhaps because a change in the distance between you and the bob is easier to believe than a change in the distance between you and the background and the reference object, both of which are known to be stationary. As a result the bob appears to move in an elliptical path even if it is the bob you are tracking. The experiment with the Pulfrich pendulum illusion is a difficult way of measuring the visual latency produced by a given dark filter. One reason other workers designed different experiments was the aim of measuring the latency more precisely. In some experiments of my own I chose to measure the response time by a relatively simple arrangement in which an observer would turn off a light I turned on. The time was measured in milliseconds. The circuit that controlled the light and the digital clock for the experiment was designed and built for me by Harry Freedman of Cleveland State University. The integrated circuit chips labeled IC (for integrated circuit) 1A and 1B in the illustration below were "D" flip-flop circuits. Initially the Q output from IC 1A would produce a logical-0 signal and the Q a logical-1 signal. (In a logical-0 signal no voltage is produced; a logical signal is one in which a voltage greater than zero is created.) When I tripped the switch S1, the outputs from Q and Q of IC 1A changed states; the Q then produced a logical-1 signal. This output state remained until the run was over and I tripped the reset switch S3, restoring Q and Q to their initial states.
On tripping S1 the logical-1 signal from the Q of IC 1A went to IC 2A, which was an "and" gate. Such a gate sends out a logical-1 signal only if both inputs to it are of the same logical states. In this case IC 1B was already sending a logical-1 signal to the gate; when I tripped my switch, the gate had two such signals coming in and therefore sent a logical-1 signal to IC 2C and IC 5E to turn on the light-emitting diode for the observer to see. Another logical-1 signal was sent from the gate IC 2A to another "and" gate (IC 2B), which compared it with the signal coming from an oscillating circuit functioning as a clock. At a rate of 1.000 times per second the clock generated a logical-l signal for IC 2B. Thus IC 2B found a match 1,000 times per second in its inputs, and so it sent at that rate a logical-l signal of its own to IC 4. The IC 4 was a four-digit counter with seven segments of decoded outputs that were used to drive a four-digit. seven-segment display indicating the observer's response time in milliseconds. The IC 4 continues to receive signals at the rate of 1,000 per second, and the display continues to flash the count until the observer trips switch S2. The output from Q of IC 1B is then flipped to be a logical-0 signal, and the gate IC 2A no longer makes a logical match between the flip-flops IC 1A and 1B. The observer's light-emitting diode goes off, and a logical-1 signal is no longer sent to the gate IC 2B. The clock's signal is therefore ignored, and the display stops with its last count and hence the observer's response time in milliseconds. All remains the same until the reset switch is tripped and both IC 1A and 1B are put back to their original states.
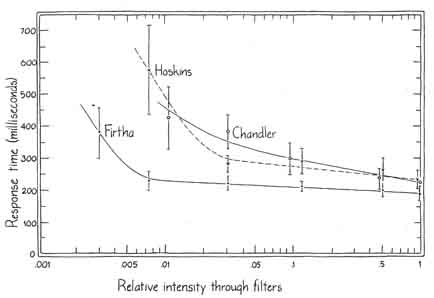
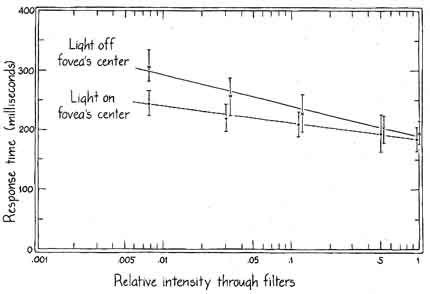
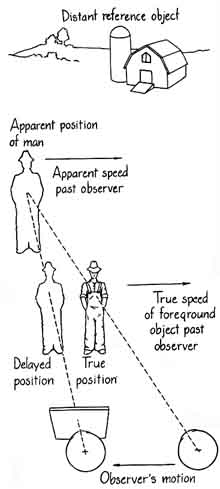
Nearly all the parts are available from the Radio Shack (check a local store or write 2617 West Seventh Street, Fort Worth, Tex. 76107) for less than $15. The IC 4 is available from the National Semiconductor Corporation (2900 Semiconductor Drive, Santa Clara, Calif. 95051) for $12. The seven-segment display can be obtained from Litronix Inc. (19000 Homestead Road, Cupertino, Calif. 95014) for about $4. Be certain never to reverse the battery connections or wire the power-supply pins of the integrated circuits backward or they will be destroyed. The resistor R5 should be adjusted so that the clock counts at the rate of 1,000 hertz (cycles per second). You can check it by allowing the circuit to count for 10 seconds as measured on a stopwatch. Since the highest reading on the display is 9999, at 10 seconds the display should again show 0000. Adjust the resistor until you have achieved this correlation. For example, increasing the value of R5 decreases the counting rate. My observers were three students at Cleveland State: Teresa Chandler, Sandy Hoskins and Bruce Firtha. An observer viewed the light-emitting diode through two large, crossed sheets of polarizing filters. By adjusting the angle between the polarizing senses of the filters I could select the illumination reaching the observer. To measure the filter angles I affixed a length of clear cellophane tape to each filter so that the tapes were perpendicular when the filters were perpendicular, thereby blocking the maximum amount of light from a light bulb. Other filter orientations were measured on a protractor laid between the tape lengths. Accuracy was probably no better than plus or minus two degrees. The intensity of the light transmitted by the crossed filters was compared with the intensity (designated 1) transmitted by parallel filters. For each orientation the relative value of the transmitted intensity was the square of the cosine of the angle between the senses of polarization of the crossed filters. I estimated the relative intensity transmitted through perpendicular filters from transmission data from the Polaroid Corporation for the type of polarizing filters I was using. Although for perpendicular filters the transmission was small, it was not exactly zero. When data were taken with the room lights on, the observers cloaked their head and the filters with a black cloth so that the lights did not produce a glare on the observers' side of the filters. Whenever the diode light came on, the observer turned it off and I recorded the response time. For each setting of the polarizing filters I took at least 50 measurements and then plotted their mean and their standard deviation. Such an average response time includes any visual latency and also the larger motor-response time of the observer. I tried to turn on the diode light randomly so that the observer could not anticipate the event. Particularly large or small response times that occasionally resulted from neglect or anticipation by the observer were eliminated from the data. One problem you may encounter is to find an observer sufficiently interested in the experiment to concentrate continuously on the diode. The experiment is tiring, and a lack of interest could increase the standard deviations considerably. I took data for observers in a dark room, first allowing at least 10 minutes for their eyes to adapt to the darkness. All data for an observer were taken at a single sitting. Mixing data taken on different days would probably complicate the experiment because of the possible daily changes in motor-response times. A plot of the data on a semilog graph is shown in the top illustration on page 148. If the motor-response times were eliminated from the experiment, the remaining visual-response times would presumably follow this same type of curve, but at shorter time intervals. In other words, the visual latency would increase as the illumination of the stimulus decreased; the rise would be sharper at low levels of illumination. I also collected data when the room lights were on. Some researchers have found that the visual latency decreases when the overall illumination surrounding the stimulus increases. Within the standard deviations in my data, however, I could find no significant difference in an observer's response curve with the room lights on and with them off. When one of my observers stared at the diode, the image of the diode fell on the fovea, which has a dense packing of cone cells but no rod cells. Some published research indicates that the visual latency may be different if the image of the stimulus falls elsewhere, partly because the visual response would then involve rods. You can search for this effect by having the observer stare at a small object displaced to the side of the diode. To check this possible change in visual response I first redetermined the response curve for Bruce Firtha (left eye only) in a semidark room. His right eye was covered with a cardboard patch. Firtha stared directly at the diode as before. The resulting curve was essentially the same as the previous one. Then I repeated the experiment with Firtha staring at a small dot three centimeters to the side of the diode. The diode was otherwise surrounded by a featureless cardboard background. This procedure made the image of the diode fall about four degrees off the center of the fovea and thus in a region that has some rods. The response curve was the same for the higher illumination levels but then increased significantly for lower levels. Such an increase suggests that in conditions of low illumination the visual latency increases faster in retinal areas outside the fovea than directly in the center of the fovea. Vision in bright light is termed photopic and is dominated by cone response. Vision in dim light is termed scotopic and is dominated by rod response. The results suggest that the scotopic vision away from the center of the fovea incorporates more visual latency than it does in the center of the fovea because of the greater abundance of rods. You can do much other work on visual latencies, either with this type of apparatus or with some other type. How does the response curve change as a function of angular distance from the center of the fovea? Is the response when the stimulus is moved toward the nose different from the response when it is moved away from the nose? You could try to map response curves for the area surrounding the fovea. If more work indicates that the rod-free center of the fovea has a response curve different from the curves of other retinal areas, you might draw tentative conclusions about the visual latency of the rods as distinguished from that of the cones. You might also try stimulus targets of different sizes. A small target viewed directly stimulates only the center of the fovea, whereas a larger target stimulates a larger portion of the retina and thus could invoke responses from rods. The visual response in such a case is a summation over the entire retinal area that is stimulated. I am not sure how the response curves should look as a function of the room lights. Although I did not find any change in the response curve by turning on the room lights (for as much as I measured, at least), you might try to repeat the experiment. You could also illuminate the eyes directly with a small light instead of illuminating the diode stimulus and its surroundings. As the eyes adapt to a higher illumination level, do they respond noticeably faster, corresponding to my findings in the pendulum illusion? Remember that in any experiment you must collect a lot of data, average the results and then compare the mean by examining the standard deviations. Two means that have been collected under different circumstances and that fall within one standard deviation o each other are normally regarded a being indistinguishable. Visual latency can affect your perception of passing scenery while you are riding in a car if you watch the roadside with a pair of sunglasses from which on glass has been removed. Fix your view on distant objects, first to one side of the car and then to the other. At the same time compare the speeds at which foreground objects seem to pass you on the two sides. If your left eye is covered with the dark glass, the objects on the left seem to pass slower than those on the right. If you judge the speed of the car by watching the passing scenery, your left-hand view indicates that the car is moving slower than it actually is. On your right side the car seems to be moving faster than it actually is. The procedure also alters the sizes and distances of foreground objects. The objects on the side of the car that gives a sensation of decreased speed tend to seem closer and smaller than they really are. The objects on the other side seem farther away and larger than they actually are.
These distortions of speed, distance and size are produced by the visual latency caused by the dark filter over one eye. That eye sends a delayed response to the brain. As with the pendulum illusion, the delayed response alters the angle between a foreground object and the reference background object. If your left eye is covered and you look to the right, the angle between the foreground object and the reference object is increased because of the delay. The increase is interpreted as meaning that the foreground object is farther away than it actually is. If the object is regarded as being more distant but it still occupies the same angular size in your field of view, you are forced to conclude that it is larger than it really is. Similarly, if you judge it to be more distant but it still crosses your field of view at the same rate (that is, in a given amount of time it crosses a particular angle in your field of view regardless of how far away you judge it to be), you are forced to conclude that it is traveling faster than it actually is. The visual latency alters your perception of the object's depth, and you in turn misjudge its size and speed past you. The distortions of speed, distance and size can be demonstrated to a small audience by employing a motion picture made from a moving car. James T. Enright of the University of California at San Diego suggests that the camera be aimed at some distant object to the side~0 of the car while the car is traveling at about 10 miles per hour. A location that has such a distant object and also foreground objects some 100 yards away will enhance the effect. Each observer in the audience wears sunglasses with one glass removed or holds some other dark filter in front of one eye. Writing in Journal of the Franklin Institute in 1940, Ronald Ives noted that at dusk the streetlights at intersections seemed to go on slightly sooner than the ones between intersections. Moreover, the second group seemed to go on sequence down the street and away from the observer. Assuming that all the streetlights were in the same circuit, the effect had to be an illusion. The effect was due to the visual latency I have been describing. There were more lights at the intersections than at any point between intersections, and so the observer received more light from the intersections. The visual latency for a bright stimulus is less than that for a dim one. Although all the lights went on simultaneously, the ones at intersections were perceived first because of the reduced visual latency from the stimulus. The lights along the street seemed to go on one by one, the remoter ones later, because their increasingly dim stimulus resulted in increased visual latency. Can the visual latency resulting from sunglasses significantly affect your reaction time when responding to a hazard? It might. Suppose your sunglasses are dark enough to add 100 milliseconds to your response time (an extreme case). If you were driving at a speed of 55 miles per hour (about 25 meters per second), the increased response time would mean an additional stopping distance of about 2.5 meters.
Bibliography STEREOPSIS, VISUAL LATENCY, AND THREE-DIMENSIONAL MOVING PICTURES. James T. Enright in American Scientist, Vol. 58, No. 5, pages 536-545; September-October, 1970. LATENCY FUNCTIONS IN HUMAN VISION. R. J. W. Mansfield in Vision Research, Vol. 13, pages 2219-2234; 1973. EYE MOVEMENTS AND THE PULFRICH PHENOMENON. B. J. Rogers. J. J Steinbach and H. Ono in Vision Research, Vol. 14, pages 181-185; 1974.
Suppliers and Organizations The Society for Amateur Scientists (SAS) is a nonprofit research and educational organization dedicated to helping people enrich their lives by following their passion to take part in scientific adventures of all kinds. The Society for Amateur Scientists |